Bitcoin Derivatives: $43.3B OI Meets a 10.9% Negative Annual Basis
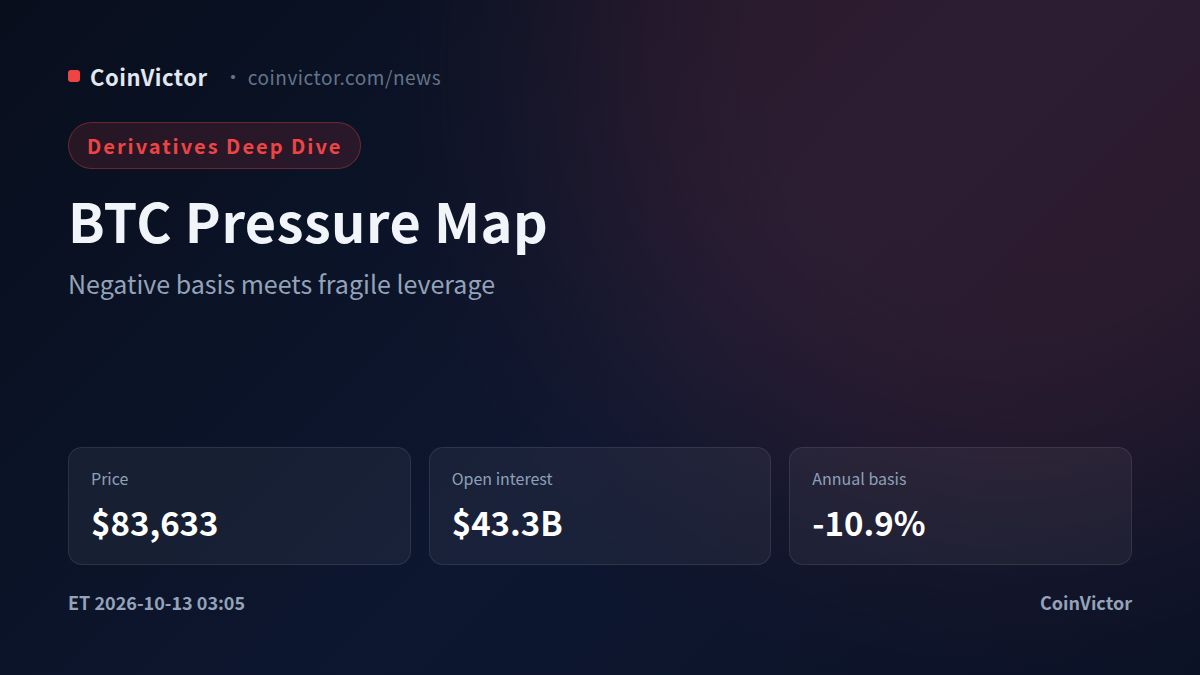
Bitcoin is trading at $83,633 while aggregate futures open interest sits near $43.3B, down 0.5% over 24 hours. The more important signal is the combination of negative carry and asymmetric liquidation: annualized basis is -10.9%, average funding is -0.0%, and 24-hour liquidations reached $220.1M, including $166.3M of longs against $53.8M of shorts. This is not a clean bullish leverage setup. It is a market where crowded downside bets can fuel a rebound, but where the price structure still has a clear liquidation pocket below.
Market coverage is split between reports of whale accumulation, regional demand and faster gains in several other crypto assets, leaving Bitcoin’s derivatives data as the clearest guide to positioning rather than headline momentum.
Open interest is contracting, but not evenly
The aggregate open interest profile points to a controlled de-risking phase rather than a full leverage washout. The ticker shows $43.3B in OI, with the broader venue summary at $43.2B across 19 exchanges. Ticker OI has fallen 0.4% over 24 hours even as trading volume rose 100.5%, a combination that usually means positions are being closed or replaced more cautiously rather than fresh leverage driving the move.
Venue behavior is mixed. Binance carries $7.8B of OI, or 18.1% of the reported total, and its OI is down 0.6% over 24 hours but up 1.4% over the shorter window. Bybit holds $4.6B, or 10.6%, after a 1.7% daily decline while also rising 1.2% in the shorter window. Gate is the outlier with $4.5B of OI, up 2.0% daily and 4.2% over the shorter window. That dispersion matters: leverage is not disappearing uniformly, and renewed exposure on Gate can amplify volatility if price reaches the lower liquidation cluster.
The current structure therefore looks less like broad capitulation and more like rotation between venues. A sustained rise in OI from the $43.3B area without price reclaiming resistance would be a warning that leverage is rebuilding before the trend has proven itself.
Funding and positioning favor a squeeze, not a confirmed reversal
Funding is mildly defensive across most major venues. Binance is at 0.0%, Bybit at 0.0%, OKX at 0.0% and Bitget at 0.0% when expressed to one decimal place under the requested format; the underlying readings remain positive on those exchanges. The ticker’s average funding is negative, however, at -0.0%, showing that the broader blend is being pulled lower by more aggressively negative venues. This divergence is important: the market is not paying a broad premium for longs, but neither is every major exchange positioned for a sustained selloff.
Account positioning still leans long. Binance shows 57.5% long accounts, OKX 57.5%, Bybit 60.9%, Bitget 62.8% and Gate 55.2%. The combined account reading is 58.8% long. Taker flow is much closer to neutral: Binance is 50.5% long, OKX is 48.9% long and Gate is 51.9% long. In other words, passive accounts are net long, while aggressive execution is balanced to slightly short depending on venue. That mix makes the upside vulnerable to short covering, but it also means a break lower could force long accounts to capitulate into relatively neutral taker flow.
The risk is therefore asymmetric in the short term but not decisively bullish in the medium term. Negative funding and negative basis create fuel for a rally, yet the lack of strong taker demand means any recovery must be validated by spot-led buying rather than derivatives chasing.
Liquidation map defines the immediate range
The liquidation record gives the clearest price map. Over 24 hours, long liquidations totaled $166.3M, while short liquidations totaled $53.8M. The imbalance is even sharper over 12 hours, with $118.6M of longs liquidated versus $51.3M of shorts. Over the shorter four-hour window, however, short liquidations reached $34.8M against only $38.8K of longs. That shift suggests the market has already bounced enough to pressure late shorts, even while the wider session still carries the scars of a long flush.
The largest recorded long liquidations were at $81,103 and $81,001, with another BTCUSDC long liquidation at $80,832. On the other side, short liquidations appeared at $84,201 and $84,368. These levels create a practical decision range. Around $81,000, additional long liquidation risk can accelerate a downside break. Around $84,200-$84,368, a sustained move can force shorts to cover and potentially lift price through a thin resistance band.
Basis confirms the market is defensive rather than euphoric: spot is trading at a discount in derivatives terms, with the ticker basis at -0.0% and annualized basis at -10.9%. Such a discount can precede recovery when OI is falling and funding is soft. It becomes bearish confirmation only if price keeps weakening while OI rebuilds and the basis remains negative.
Verdict: The medium-term structure is cautiously bearish below $84,368, but the more fragile side in the immediate trade is the short side because funding and basis are defensive while short liquidations have already appeared above $84,200. A break and hold below $81,000, accompanied by OI rising above $43.3B and another wave of long liquidations, would confirm that downside leverage is being rebuilt and expose the market to a deeper deleveraging phase. Conversely, a close above $84,368 with OI expanding from $43.3B while funding remains near current levels would invalidate the bearish structure and confirm a squeeze-led recovery. Data as of 15:05 Beijing time on Oct 13, covering Binance, OKX, Bybit and other major venues.