Bitcoin at $85,297: OI, Funding and Liquidations Reveal Fragility
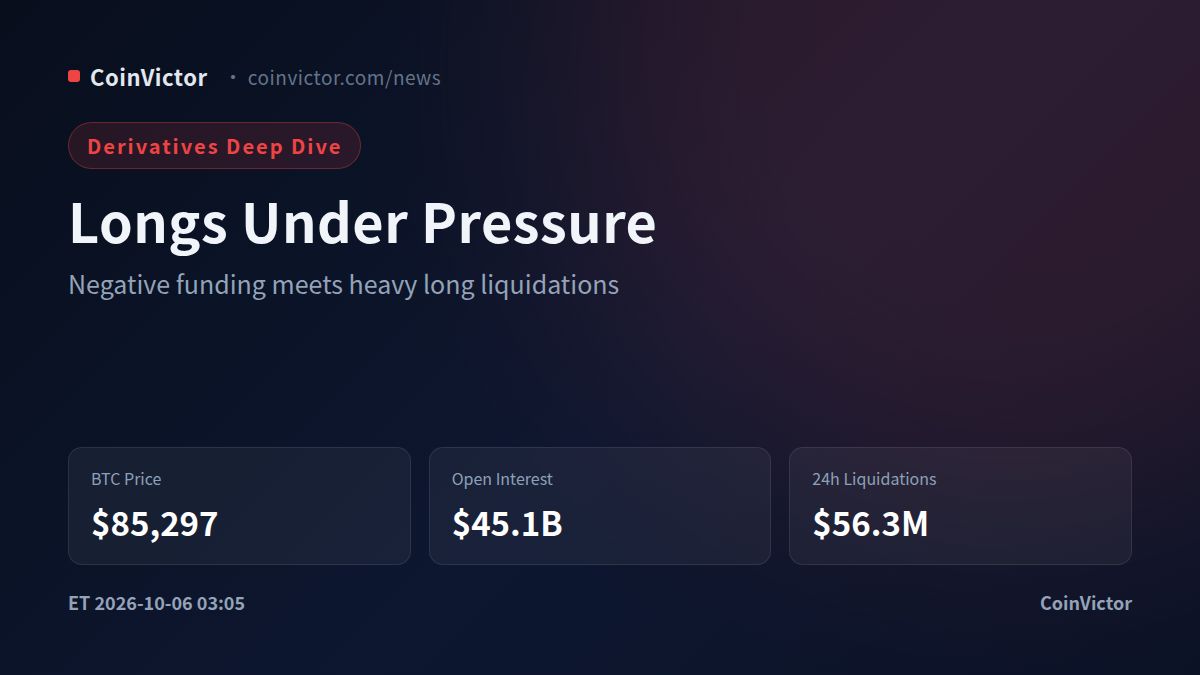
Bitcoin is trading at $85,297 after a 1.1% decline, but the more important signal is underneath the spot move: total open interest is about $45.1B, down 1.0% over 24 hours, while the market recorded $56.3M in forced liquidations. Of that total, $43.3M came from longs and $13.0M from shorts. This is not a neutral deleveraging event. It shows that bullish positioning was more exposed, yet the reduction in OI has not been large enough to suggest that leverage has been fully cleared.
News context: reports say El Salvador’s Bitcoin reserve passed an IMF review, while broader market coverage has focused on a renewed attempt to push October prices higher.
OI is falling, but not collapsing
The OI structure gives the first part of the explanation. Across 20 venues, aggregate OI has declined 0.8% in 24 hours. Binance holds $8.1B, or 17.9% of the reported total, after a 3.4% daily contraction. Bybit holds $4.9B, or 10.8%, down 0.4%, while OKX carries $2.5B, or 5.5%, down 0.6%. The largest venues are therefore reducing exposure rather than adding fresh leverage into weakness.
However, the shorter-term picture is less uniformly defensive. Binance OI rose 0.5% over four hours, Bybit rose 0.5%, and OKX rose 0.4%. Bitget rose 2.2% over the same window, even though its daily change was nearly flat. Deribit also increased 3.6% over 24 hours. That combination matters: the broad market is shedding leverage, but some books are rebuilding exposure during the pullback. If price remains below the upper liquidation zone, this can create a second wave of forced exits rather than a stable base.
The market’s basis is especially defensive. The reported basis is -0.1%, with an annualized reading of -19.3%. A negative basis means futures are trading below spot, so the derivatives curve is not pricing an aggressive chase higher. It also limits the case for calling the current decline a simple long squeeze that has already finished: the curve still reflects caution and hedging demand.
Funding and positioning lean long
The funding signal reinforces that imbalance. The aggregate eight-hour funding reading is -0.00013216, meaning the composite rate is negative even as account positioning remains net long. Account data show 54.5% long and 45.5% short overall. On the major venues, the long share is 52.4% on Binance, 54.6% on OKX, 55.6% on Bybit, 57.7% on Bitget and 52.2% on Gate.
That is a subtle but important divergence. Traders are directionally positioned for upside, yet they are not paying a uniformly positive funding premium to hold those longs. The negative composite rate may reflect the stress in the futures curve and the liquidation of leveraged buyers, rather than a durable short consensus. Taker flow is even more one-sided: buyers represent 61.6% on Binance, 55.4% on OKX and 68.7% on Gate. Aggressive participants are still buying dips, but price has not responded with a sustained advance. When taker buying fails to lift spot while OI remains substantial, longs become vulnerable to another downward impulse.
The long/short account ratio therefore should not be read as a standalone bullish signal. It describes exposure, not profitability. With spot near $85,297, a meaningful amount of bullish positioning is sitting close to liquidation areas, while negative funding suggests that the market is already under pressure despite that demand.
Liquidation map defines the battle
The liquidation distribution is the clearest evidence of near-term fragility. In the last hour, long liquidations reached $3.5M against only $3.0K of shorts. Over four hours, longs accounted for $4.5M versus $0.3M for shorts. Over 12 hours, the split was $6.2M long and $4.6M short. Across 24 hours, long liquidations were more than three times larger than short liquidations.
The largest recorded event was a $11.8M Binance long liquidation at $84,775. That price is the first major downside reference: a return to it would test whether forced selling has actually been absorbed. There are also Binance and OKX long liquidations around $85,175-$85,185, while a Hyperliquid long was liquidated at $85,505. These nearby levels show that longs are not positioned far beneath the market; modest weakness can still trigger mechanical selling.
Above spot, the largest identified short liquidation was $1.5M on Binance at $86,889. That makes the upper boundary important for the opposite reason. A decisive recovery through $86,889 could force shorts to cover, but the current OI decline and negative basis mean that such a move would need confirmation rather than assumption. The one-hour RSI is 41.4, four-hour RSI is 50.8 and daily RSI is 62.2, which describes short-term softness inside a still-firm higher-timeframe momentum backdrop.
Verdict: the medium-term structure is cautiously bearish on leverage, not decisively bearish on trend. Longs are the more fragile side because they dominate account positioning, taker flow has not produced a durable breakout, and $43.3M of the past-day liquidations came from them. The key downside level is $84,775; a break there with OI holding near or above $45.1B would signal that liquidation pressure is expanding rather than clearing. The bullish invalidation is a sustained move above $86,889 accompanied by rising OI and funding turning positive; without that combination, rallies remain vulnerable to distribution. Data as of 15:05 Beijing time on Oct 6, covering Binance, OKX, Bybit and other major venues.