ETH ETF First Outflow in 3 Weeks: -$48.1M, AUM Off Record
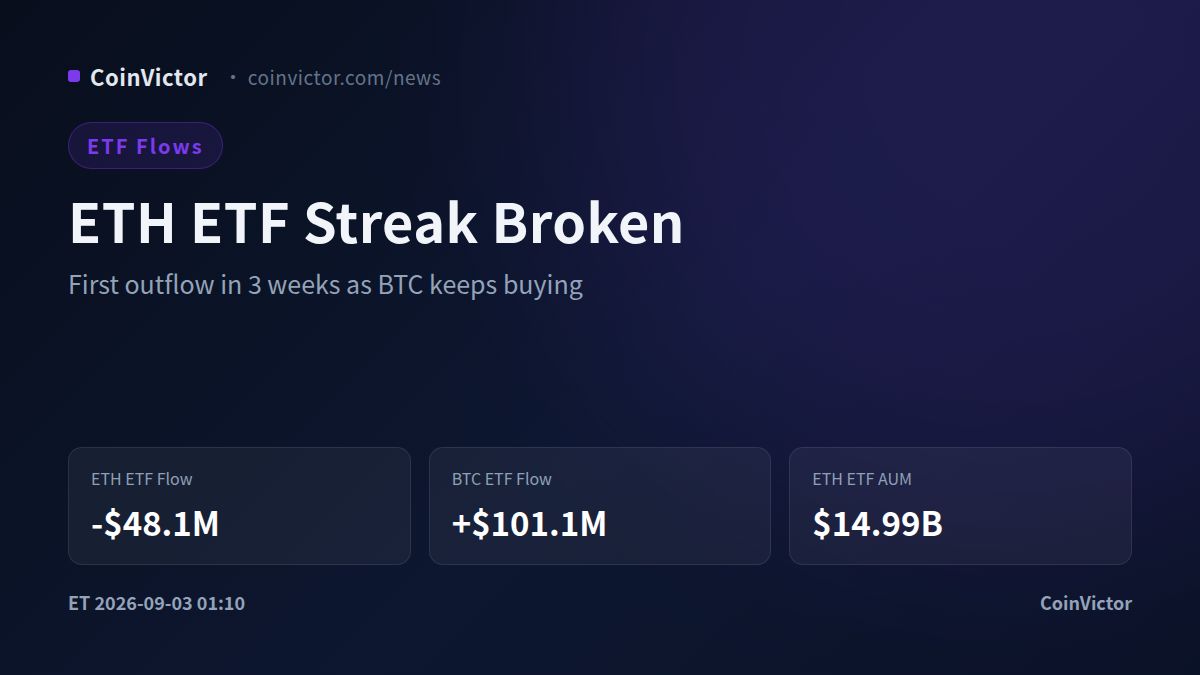
ETH spot ETFs posted their first outflow in three weeks on Sep 2, with -$48.1M leaving the group and ending a 12-session inflow streak. Net assets slipped to $14.99B, off the record $15.61B touched on Aug 31. The pullback looks contained so far: the seven-day flow total is still +$759.4M, and BTC ETFs absorbed $101.1M on the same day.
ETH ETF: 12 Inflow Days, Then a Red Session
The fund complex had not seen a net redemption day since mid-August. Between Aug 17 and Sep 1, the products took in money on twelve straight trading sessions, adding roughly $1.6B in the process. The run peaked on Aug 27 with a $234.5M single-day inflow, and AUM hit its all-time high of $15.61B on Aug 31. Sep 2 flipped that script: -$48.1M flowed out, a modest number next to the daily swings of the past month, but a break in the pattern all the same.
BTC ETFs Kept Buying the Same Day
Sep 2 was not a risk-off day for the broader fund market. BTC spot ETFs took in $101.1M, lifting cumulative inflows to $54.76B, with AUM at $97.2B and a seven-day total of +$668.3M. That split matters. Institutional money is rotating toward BTC rather than leaving the crypto ETF complex, and the $100B AUM mark, crossed in late August, sits roughly $2.8B away.
What the ETH Outflow Actually Means
The token traded near $2,399 at the time of writing, down about 0.9% over 24 hours, with a session range of $2,355 to $2,429 on both Binance and OKX. AUM also moves with price, so part of the roughly $620M drop from the record is mark-to-market, not redemptions. One $48M outflow day after three weeks of steady buying reads as a cooling signal, not a trend break, especially with the seven-day flow still firmly positive.
What to Watch Next
The next US session will show whether this was a one-day blip or the start of a redemption wave. A second consecutive net outflow, or a break of the $2,355 low, would shift the picture; a return to inflows would confirm holders treated the record AUM as a profit-taking level. For now the ETH/BTC flow gap is the cleaner signal to track, since it tells you where institutional bids sit.
Data as of 13:10 Beijing time, Sep 3. ETF flow and AUM figures cover the Sep 2 US trading session; ETH prices cross-checked on Binance and OKX.