Ethereum Derivatives: $26.5B OI Meets 67.0% Long Accounts Today
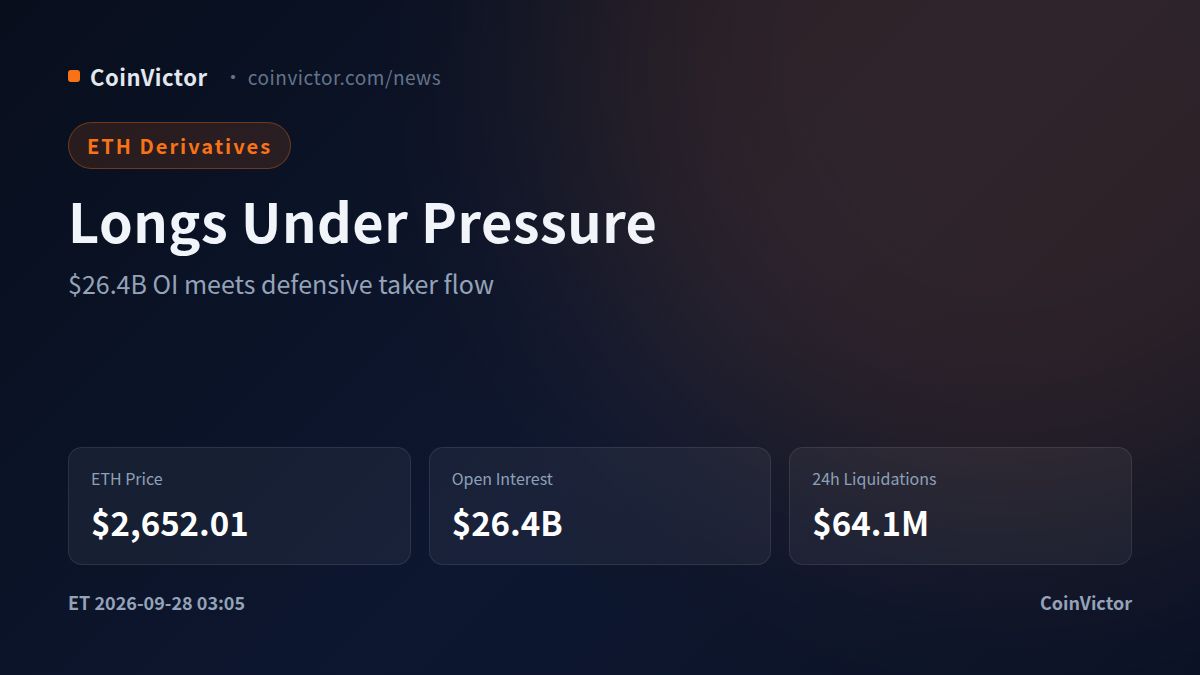
Ethereum is trading at $2,652.01 after a 2.1% daily decline, but the more important signal is what leverage did during the move: aggregate open interest is $26.4B, down 1.0% in 24 hours, while $64.1M of positions were liquidated. That combination describes a market that is shedding risk rather than building a clean bullish continuation. The immediate structure is not uniformly bearish, however. Account positioning remains heavily long, funding is slightly negative, and taker flow has already turned more defensive. The result is a crowded-long market with a possible short-term relief mechanism, but a weaker medium-term foundation until leverage resets more decisively.
Market coverage has recently emphasized ETH's strong quarterly advance alongside a governance vote that moved dual governance onto Ethereum mainnet, keeping the broader narrative constructive even as derivatives data cools.
OI is falling, but not yet capitulating
The headline OI figure is $26.4B across 21 venues, with the ticker aggregate at $26.5B. The difference is small enough to treat the readings as the same broad leverage pool. Binance carries $6.1B, or 23.0% of the reported share, while Gate holds $2.4B and 9.1%, Bitget $2.1B and 8.0%, and Bybit $2.1B and 8.0%. This is a distributed positioning problem rather than a single-venue anomaly.
Venue changes show the deleveraging is uneven. Binance OI fell 1.9% over 24 hours, Bybit fell 1.5%, and Gate dropped 6.5%, the sharpest contraction among the major reported pools. OKX rose 0.1%, while Deribit increased 1.8%. Over the shorter four-hour window, OKX, Bitget and Deribit were still adding OI, rising 1.0%, 1.1% and 1.2% respectively. That matters because the market has not reached a broad liquidation-driven flush: some participants are still replacing risk as other traders exit. The one-hour OI change was positive at 0.3%, even though the daily trend remained negative.
Volume adds stress to the interpretation. Twenty-four-hour volume increased 59.0% while price declined, suggesting active transfer of risk rather than a quiet drift lower. A sustained fall in OI alongside heavy volume would be healthier for the medium-term structure; a rebound in OI without price recovery would instead imply that leverage is returning into resistance.
Positioning says longs are vulnerable, not invincible
The account long/short ratio is the clearest source of fragility. Across the ticker data, 67.0% of accounts are long. Binance is even more one-sided at 73.8% long, Bitget at 74.4%, and Bybit at 67.7%. OKX is less crowded at 60.3%, while Gate is the closest to balance at 58.8%. These figures do not prove that price must fall, but they show where forced selling is likely to concentrate if support breaks.
Taker positioning is materially less optimistic. Binance takers are 52.8% long, but OKX takers are 53.8% short and Gate takers are 57.5% short. In other words, passive account inventories still lean long while aggressive traders are selling into the market. That divergence often precedes either a flush of stale longs or a rebound if sellers fail to extend the breakdown. The current funding backdrop reinforces the asymmetry: the average eight-hour funding rate is negative, and Binance and Bybit are also negative while several other venues remain positive. Negative funding limits the cost of holding shorts and does not yet show the kind of euphoric long premium associated with a late-stage upside squeeze.
The liquidation distribution makes the vulnerable side explicit. Long liquidations reached $53.8M over 24 hours against $10.4M for shorts. Over 12 hours, longs accounted for $46.2M versus $5.7M for shorts, and over four hours the gap was $13.5M to $0.9M. The largest recorded event was a $4.6M long liquidation at $2,644.98, followed by $1.8M at $2,629.94 and $1.3M at $2,637.15. These are not random marks: they cluster close to the current market and show that downside probes are already removing leveraged longs.
Basis confirms a defensive medium-term regime
The basis is -0.0% on the spot-versus-futures reading, but its annualized measure is -16.9%. That negative annualized basis is more consequential than the rounded spot figure: futures are not carrying a meaningful bullish premium, and the curve is pricing defensive demand for protection or short exposure. Together with negative average funding, it argues against treating every dip as an automatic buying opportunity.
The key price zone is therefore $2,644.98 to $2,654.07, where several large long liquidations were recorded and where ETH is currently trading. Holding above that cluster while OI declines would suggest that leverage is being cleaned out without destroying spot demand. A break below $2,629.94 would be more damaging because it would move beneath another large liquidation level and could pull additional crowded longs into forced exits. On the upside, a recovery must be judged by leverage quality: price reclaiming the liquidation cluster with OI still falling would be constructive, while price rising with OI rebuilding rapidly would be a less reliable squeeze.
Verdict: The medium-term bias is cautiously bearish-to-neutral, with longs more vulnerable than shorts because 67.0% of accounts are long, long liquidations dominate, and the annualized basis is -16.9%. ETH needs to hold $2,644.98 and reclaim $2,654.07 while OI moves below the $26.4B-$26.5B area or remains stable after deleveraging. A decisive break below $2,629.94 with OI expanding would confirm renewed downside pressure. This view is invalidated if ETH sustains trade above $2,654.07 while aggregate OI rises from $26.4B and taker positioning turns clearly long, showing fresh demand rather than trapped leverage. Data as of 15:05 Beijing time on Sep 28, covering Binance, OKX, Bybit and other major venues.