XRP at $1.3084: OI Falls 6.0% as Longs Face a Fragile Reset
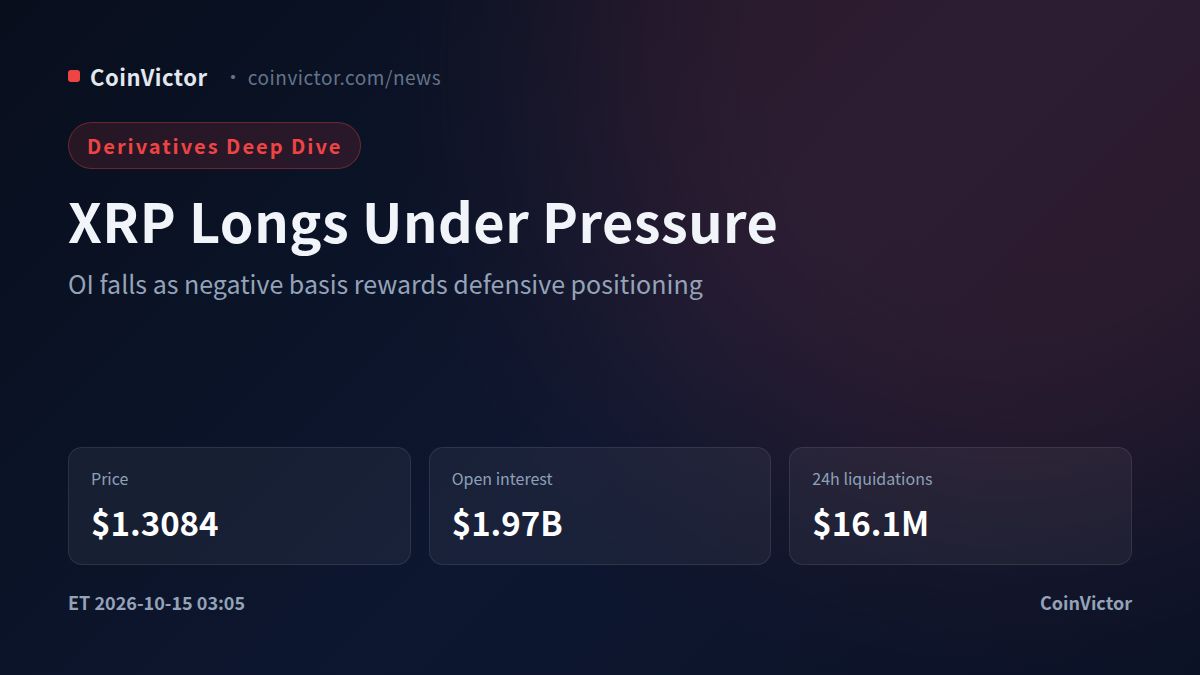
XRP is trading at $1.3084 after a 4.5% decline, with open interest at $1.97B, down 6.0% over 24 hours, while volume has risen to $3.30B. That combination says the market is active but leverage is being removed. The key question is whether this is a healthy reset after crowded positioning or the first phase of a deeper downside move. Current derivatives data leans toward the latter risk: longs remain heavily represented in account positioning, yet aggressive traders are selling into the tape, and the futures curve is already pricing a defensive market.
Recent coverage has focused on a threatened channel breakout, institutional XRP custody, and XRPL startup activity, while broader market attention is turning to inflation data.
OI is falling, but not yet washed out
The headline OI decline is broad rather than isolated. Binance holds $391.8M of XRP OI and is down 4.8% over 24 hours; Bybit carries $253.2M after a 6.7% decline; Bitget has $228.1M after a 5.6% drop; and Gate holds $267.9M after a 2.7% reduction. OKX is smaller at $87.4M and down 1.9%. The largest venues are therefore participating in deleveraging, with Bybit showing the sharpest major-venue contraction in this set.
Yet the structure does not look fully cleansed. OI has risen 1.5% over the latest hour even as the daily balance remains negative. That rebound can mean dip buyers are reopening positions before price has established a firm base. It also leaves a clear test: if XRP falls back toward the recent liquidation cluster while OI expands, the market would be adding risk into weakness instead of completing a reset. The current OI zone around $1.97B is consequently an important confirmation level. A sustained move below that area with falling OI would look more like capitulation; a move lower with stable or rising OI would be more dangerous.
Positioning is long by account, short by execution
The long-short split exposes the market's internal conflict. Across the tracked account data, 77.6% of accounts are long. Binance shows 73.0% long, OKX 78.0%, Bybit 79.9%, Bitget 85.7%, and Gate 71.4%. This is a substantial concentration of directional optimism, especially on Bitget and Bybit. Account counts do not measure position size, but they do show that the average participant is positioned in the direction most vulnerable to another liquidation wave.
Taker flow is less optimistic. Binance takers are 34.0% long versus 66.0% short, while Gate is 40.1% long versus 59.9% short. OKX is the exception, with 56.1% long takers. The aggregate message is that existing accounts are long, but market orders are more willing to sell. That often describes a market where holders are defending positions while fresh execution is bearish. It also explains why a negative funding environment has not automatically produced a squeeze higher: shorts are paying little, and buyers have not yet regained control of immediate order flow.
Liquidations confirm that the downside has already punished longs. Over 24 hours, long liquidations reached $15.5M against $639.6K of shorts, for a total of $16.1M. The largest recorded events were long liquidations at $1.2808 and $1.2891, each close to $395K, followed by another at $1.2886 worth $219.3K and one at $1.2987 worth $214.0K. These prices form a practical stress band below the current market. The 4-hour window had $585.0K in long liquidations against $139.6K in shorts, while the 1-hour window showed only $2.2K of longs and $65.0K of shorts, suggesting the immediate forced-selling burst has cooled rather than fully reversing the broader imbalance.
Negative basis makes the medium-term signal defensive
The basis is -0.0459%, equivalent to an annualized -16.8%. That is a meaningful negative carry signal: futures are trading below spot, so the market is paying a premium for downside protection or reflecting excess short demand. Average funding is also negative, while Binance, Bybit and OKX all show negative current funding. Other venues are positive, so this is not a uniform short squeeze setup, but the major liquidity centers are not offering evidence of crowded bullish leverage.
Technically, momentum is weak across the measured horizons. RSI is 38.9 on the 1-hour chart, 31.5 on the 4-hour chart and 36.1 on the daily chart. The 4-hour reading is the most stretched, but it is not enough by itself to establish a reversal. Oversold momentum can persist when OI has not been fully cleared and account longs remain crowded. The strongest bullish interpretation would require price to reclaim the $1.2987-$1.3084 area, followed by improving taker demand and OI that rises without another liquidation spike. A recovery supported only by short covering would be less durable.
Verdict: The medium-term structure is bearish-to-neutral, with longs more fragile than shorts. The key downside zone is $1.2808-$1.2891, where the largest long liquidations were recorded; the key market-structure reference is $1.97B of OI. A break below $1.2808 while OI remains near or above $1.97B would invalidate the idea that leverage is being cleanly flushed and would favor continuation lower. Conversely, a reclaim of $1.3084 with declining OI, positive taker demand and a shift away from negative basis would invalidate the defensive view. Data as of 15:05 Beijing time on Oct 15, covering Binance, OKX, Bybit and other major venues.