BTC ETF Rebounds to $99.6B: Monday Inflow $216.7M
BTC ETF: Back Over the Line
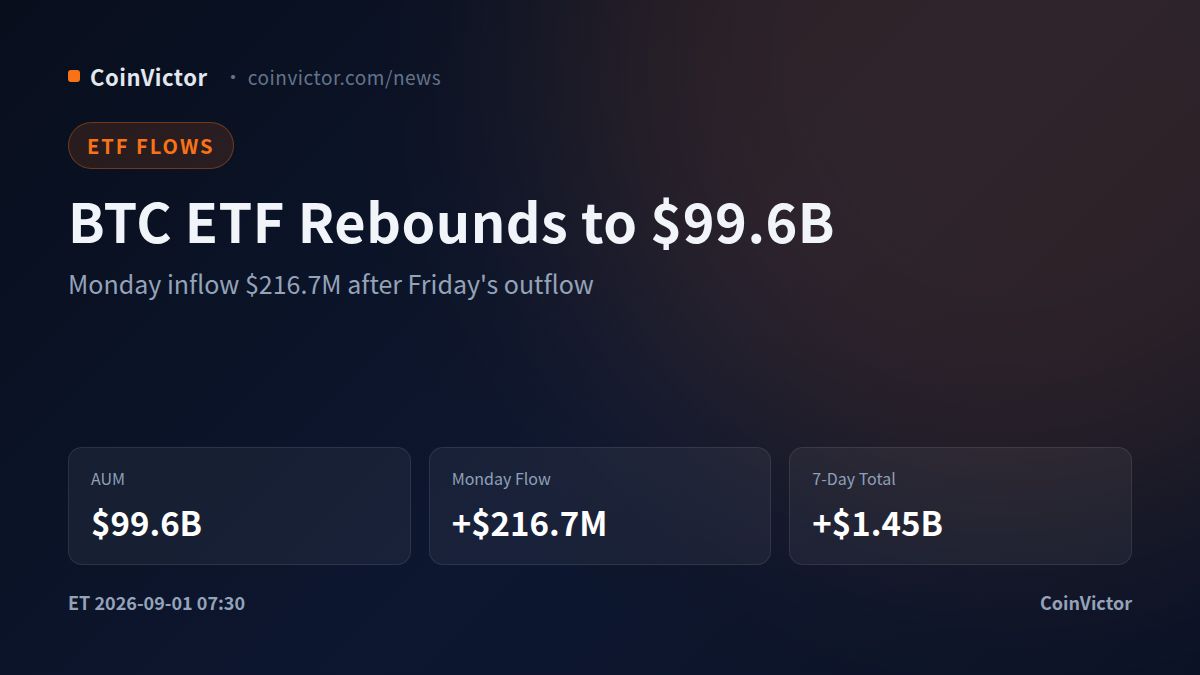
Bitcoin spot ETFs ended last week on a sour note. Friday's session logged a $201.8 million net outflow, the first big withdrawal in over a week, and total assets under management slid back below the $100 billion round number to $97.6 billion. Monday changed the mood. The group took in $216.7 million, and AUM recovered to $99.6 billion, within a whisker of reclaiming that milestone.
The swing is worth reading closely. Friday's outflow did not turn into a run. Monday's inflow was roughly the same size as the Friday drain, and it came without any dramatic price move in Bitcoin, which is trading around $78,000. That pattern, money leaving on a dip and returning on flat price action, points to allocation decisions rather than panic selling.
One-Day Flows vs. the Seven-Day Tape
Zoom out and the picture is cleaner. The seven-day rolling total for BTC ETFs sits at a positive $1.45 billion. Within that window, only Friday printed red. Four of the last five sessions had inflows, and three of them cleared $200 million. Monday's $216.7 million is consistent with that pace, not an outlier.
Since the start of the year, cumulative BTC ETF inflows have reached $54.9 billion. The asset class keeps absorbing supply regardless of short-term price wobbles, and the AUM base has grown from roughly $77 billion in mid-August to just under $100 billion now, a gain of about 29% in two and a half weeks.
Why This Matters for Position Sizing
For traders, the ETF tape is a useful tell on spot demand. When AUM climbs while the price drifts, it usually means coins are moving into custodial wallets and out of circulation. That is a slow-burn bullish setup, not a guarantee of direction, but it explains why dips below $78,000 keep getting bought.
The flip side is also visible in the data. Outflows like Friday's $201.8 million show the flows are not one-way. A string of two or three consecutive red days would take AUM back below the round number and could put pressure on the $77,000 zone. Watch the next session's flow print before assuming the rebound has legs.
What to Watch Next
The immediate question is whether Monday's inflow extends. If Tuesday and Wednesday both print green, the $100 billion mark becomes a formality and the next psychological level is $102 billion. If flows stall instead, the Friday pattern repeats and $99.6 billion becomes the ceiling for now. Either way, the seven-day trend, not the single day, is the signal that matters.
Data as of Beijing time Sep 1, 19:30, covering BTC spot ETF flows across major issuers including BlackRock, Fidelity, Grayscale, Ark and Bitwise.